A downloadable version of this activity is available in the following format:
1. Normal distribution
Let’s look again at the data from our 100 different samples of 20 heights (see Appendix A).
Recall:
| Mean of the sample means is approximately equal to the population mean. |
The standard deviation of the sample means is approximately equal to standard error. |
Clearly, the distribution of sample means appears to be normal. (In fact, if all possible samples of 20 heights were taken, the distribution would be perfectly normal.) Based on this result,
a. what percent of the sample means should fall within one standard error of the mean of the sample means?
b. what percent should fall within two standard errors?
c. verify these expectations using the sample means in Appendix A. Are they exactly as you expected? Explain.
What does this say about a single random sample of 20 heights?
This suggests that if we were to select one sample of 20 students at random from this population, the mean of the sample has a 68% chance of being within one standard error of the population mean and a 95% chance of being within two standard errors of the population mean.
2. The central limit theorem
We have seen that sample size plays a role in the distribution of the sample means. To ensure a normal distribution of the sample means, we choose 30 samples or more. Thus, we can state the following central limit theorem:
| When |
Consider this scenario:
Imagine you are trying to determine the mean height of students at your high school. It is impractical to use the heights of all the students, so you get height data for a random sample of 30 students.
- Do you expect the mean of this sample to be exactly the same as the mean of the population?
- Do you expect the sample mean to be close to the population mean? If so, how close do you expect these means to be?
The mean height of your random sample is called a point estimate. It’s a single sample statistic used to estimate the population mean. Experience tells us that if a different random sample were chosen, we likely would get a different mean and thus a different point estimate. This is because of variation in the sample means.
To account for this, we determine an interval estimate of the true population mean by taking into consideration the sampling distribution of the mean. Depending on how confident we wish to be that the interval will contain the population mean, we can choose different-sized intervals. The larger the interval is, the more confidence we can claim. Is there a down side to making the interval large? Typically, we use intervals that can claim 95% confidence
A 95% confidence interval means that if we were to choose all possible samples of the same size, in 95% of the samples, the true population mean would be included in the interval around the sample mean in 95% of the samples.
Exercise: Examine different samples
Examine the four example diagrams on the next page. The samples are chosen from the original height data, with![]() and
and![]() . Sample 1 is explained below.
. Sample 1 is explained below.
Sample 1
Given: ![]() and
and ![]()
Therefore ![]()
Determine the interval within 2![]() of
of ![]() .
.

Does it contain the population mean?
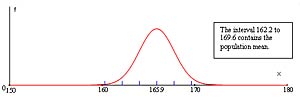
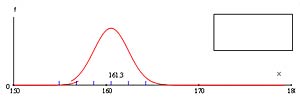
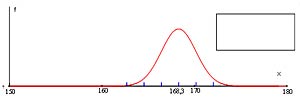
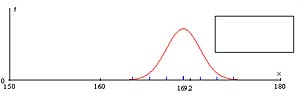
Perform similar calculations for Samples 2, 3 and 4. For each sample, determine whether the interval contains the population mean.
| Sample 1
|
 |
| Sample 2
|
 |
| Sample 3
|
 |
| Sample 4
|
 |

Since the distribution is normal, we can assume that any sample mean has a 95% chance of being within two![]() of the population mean.
of the population mean.
Clearly, not all samples will have a mean within two ![]() of µ We expect, however, that 95% of the sample means will be within two
of µ We expect, however, that 95% of the sample means will be within two ![]() of µ.
of µ.
If we know the standard deviation of the population, we can use the standard error to determine the interval around the sample mean which has a 95% probability of enclosing the population mean.
In reality, we usually don’t know the mean or the standard deviation of the population. Remember the scenario where we want to determine the mean height of students in our high school. In that case, we only know the heights of a random sample of 30 students.
What if we don’t know what  is?
is?
We need to look again at the information that we do know and how it relates to![]() .
.
Look at the standard deviations of the samples in the exercise. First, be aware that the calculation for the standard deviation of a sample is slightly different from the calculation of the standard deviation of the population.
( ). Notice that your TI-83 calculator’s 1-Var Stats menu provides both
![]() (sample standard deviation) and
(sample standard deviation) and ![]() (population standard deviation) functions.
(population standard deviation) functions.
The difference is that instead of dividing by the sample size (n), we will divide by n-1. In order to compute![]() , we first need to know what
, we first need to know what ![]() is. Therefore, only n-1 of the sample values are free to vary. The nthis determined since
is. Therefore, only n-1 of the sample values are free to vary. The nthis determined since![]() has also been determined.
has also been determined.
For example, suppose a sample of three values has a mean of 10. Since the mean is 10 and n= 3, only two distinct values need to be known before the last one is fixed; it is determined by the information since the sum must be 30.
Look at the values in Appendix A. They are relatively close to the value of
![]() . In fact, a statistician named William S. Gosset developed a distribution that came to be known asStudent’s distribution.Based on his work, it is reasonable to replace
. In fact, a statistician named William S. Gosset developed a distribution that came to be known asStudent’s distribution.Based on his work, it is reasonable to replace ![]() by
by ![]() in our formula for
in our formula for ![]() , giving
, giving![]() .
.
Thus, the 95% confidence interval for the population mean is given approximately by the formula:
![]() , which means that
, which means that ![]()
The variables can be determined from the random sample if![]() . As well, both an interval estimate can be stated for the population and a level of confidence can be specified.
. As well, both an interval estimate can be stated for the population and a level of confidence can be specified.
3. Project time
Go to the Census at School website at www.censusatschool.ca or to any other site where you can find reliable data. Decide what quantitative information you would like to explore and what population you wish to sample. Perform the calculations and write a brief newspaper-style report about the population based on your sample results.
Contributed by Anna Spanik, Math teacher, Halifax West High School, Nova Scotia.