Downloadable versions of this activity are available in the following formats:
Note: Teachers, see Teacher’s notes.
Interpreting circle graphs
The circle graph below shows the results of a survey about the types of pets that students have. A total of 58 students answered the survey and no student owned more than one pet.
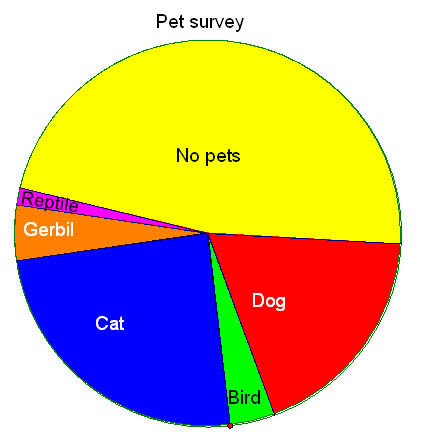
1. Estimate how many students
a. own a dog
b. own a cat
c. do not own a pet
d. own a reptile, a gerbil or a bird
e. Record your estimates in your notebook.
2. Discuss your estimates with a classmate.
Are your estimates reasonable? Revise them if necessary.
Be prepared to explain to the class how you arrived at your estimates.
Creating circle graphs
The following table gives the results of a survey where students were asked how they get to school.
Complete the table and use your results to create a circle graph. Be sure to include a title on your circle graph.
Table 1 – Methods of getting to school
| Method of getting to school | Number of students | Fraction of the whole | Decimal | Percent |
|---|---|---|---|---|
| School bus | 58 | * | * | * |
| Car | 7 | * | * | * |
| Walk | 35 | * | * | * |
| Cycle | 12 | * | * | * |
| Public transit | 18 | * | * | * |
| Other | 0 | * | * | * |
| * This cell needs to be filled out by the students. | ||||

Comparing graphs
The same data used in the table and your circle graph above are presented in this bar graph:
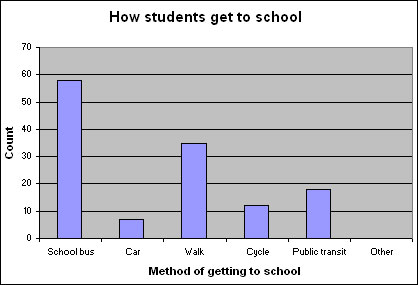
- Do both graphs give you a good picture of the data? Explain.
- If you saw only the bar graph, how would you be able to figure out the total number of students surveyed?
- Which of these two graphs do you prefer-the bar graph or the circle graph? Why?
- What kind of information is easier to read from the circle graph?
- What kind of information is easier to read from the bar graph?
Project
- From your class file of responses to the Census at School questionnaire, choose a set of data.
- Create a data table. Be sure to include column headings.
- Use either a circle graph or a bar graph to display the data. Think about your choice. Be sure to include important labels.
- Write a report for a school or community newspaper to highlight your results. Include information you think might be important to your readers. Be sure to choose an interesting headline that will capture your readers’ interest.
Contributed by Anna Spanik, Math teacher, WestHalifax High School, Nova Scotia.