Downloadable versions of this activity are available in the following formats:
(RTF, PDF)
People in Canada are getting better at recycling and doing other earth friendly activities to save our planet.

For example, in 1994, about 6 out of 10 Canadian households recycled their waste paper. This increased to about 8 out of 10 households, in 20061.
Look at the graph below to see how we are helping our environment:
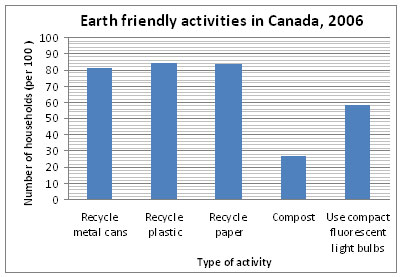
Source: Statistics Canada, Households and the Environment Survey, 2006
Use the graph to answer these questions:
1. Circle the type of material that is being recycled by the most Canadian households.
Metal cans Plastics Paper
2. a) In what activity does the lowest number of households participate? ![]()
b) Why do you think so few households participate in this activity? ![]()
![]()
3. How many Canadian households (out of 100) used at least one compact fluorescent light bulb in their home? ![]()
How does your class care for the environment?
4. Use your class Census at School database to fill in the chart for your class:
| How many students in your class…? | Recycle: | Compost | Use any compact fluorescent bulbs | ||
|---|---|---|---|---|---|
| Metal Cans | Plastics | Paper | |||
| Number of students | |||||
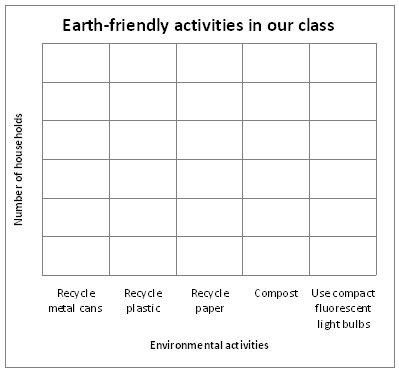
5. On the graph paper, make a bar graph with the information for your class.
Remember to include a title, scale and labels for the axes.
Use the graph for your class to answer these questions:
6. Circle the type of material that is being recycled by the most student households:
Metal cans Plastics Paper
7. In what activity does the lowest number of student households parrticipate?
![]()
![]()
8. What changes could your class make to help our environment be healthy?
![]()
![]()
![]()
9. What could you do differently, at home and at school, to care for the environment?
![]()
![]()
![]()