Now it’s easier than ever to use Census at School in your classroom!
Watch the videos below or on TeacherTube or YouTube.
NOTE: These videos were prepared when the Census at School Canada Project was managed by Statistics Canada. Apart from references to navigation on the former website, most of the information is still relevant.
 |
Episode 1: Teacher preparations
7:49 min. Teacher preparations – Seven steps to get ready for the on-line survey with the class |
 |
Episode 2: Teacher and class registration
6:27 min. This episode will guide you through two preparations you need to know as a teacher before you can use Census at School with your students. |
 |
Episode 3: Preparing the class for the survey
6:30 min. This episode will guide you through two preparations you need to do with your students before they complete the Census at School survey. |
 |
Episode 4: Completing the survey with the students
7:05 min. This episode will give you a heads-up about how to answer any questions that arise. |
 |
Episode 5: Getting the class results
5:27 min. This episode will show you how to access your class results after the students have completed the on-line survey. |
 |
Episode 6: Learning activities and Canadian Summary data
7:28 min. This episode will show you two places on the Census at School website where you can find ideas for interesting activities with your students. |
 |
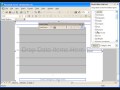
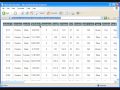
Episode 7: Excel basics: Importing the data and editing the spreadsheet
9:23 min. This episode focuses on importing your Census at School class dataset with the spreadsheet program Microsoft Excel and editing it for classroom use. |
 |
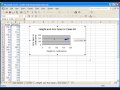
Episode 8: Using Excel to create bar graphs and circle graphs
8:04 min. This episode will cover creating basic graphs like bar graphs and circle graphs in Microsoft Excel using a frequency table. |
 |
Episode 9: Using Excel to create scatter plots
5:12 min. This episode will cover creating scatter plots in Microsoft Excel. |
 |
Episode 10: Graphing in Excel using pivot charts
9:37 min. This episode will demonstrate how to graph data in Excel with just a few quick steps, using the Pivot Chart function. |
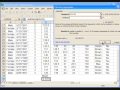 |
Episode 11: Using formulas in Excel to find the Mean, Median and Mode
3:23 min. This episode will show you how to use spreadsheet formulas to find the three measures of central tendency: mean, median and mode. |
 |
Episode 12: Importing the class results with TinkerPlots
5:48 min. In this episode, I'll show you how to import your Census at School data into TinkerPlots. |
 |
Episode 13: Using the class results with TinkerPlots
10:57 min. In this episode, we'll look at how to use TinkerPlots to create various sorts of graphs and find the mean, median and mode. |
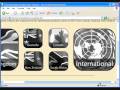 |
Episode 14: Getting a random sample from the international site
6:11 min. This episode will demonstrate how to obtain a random dataset using the International Census at School random data selector. |
 |
Episode 15: Importing an international random dataset into Fathom
2:24 min. In this episode, I'll show you how to import a download of international Census at School data into Fathom. |
 |
Episode 16: Using an international random dataset in Fathom
10:56 min. In this episode, we will look at how to use the statistical program Fathom, to analyse a dataset taken from the International Census at School database. |