Downloadable versions of this activity are available in the following formats:
(RTF, PDF)
![]() From 1994 to 2006, the percentage of households in Canada who recycled or did other things to save energy and save our planet increased by about 25%1.
From 1994 to 2006, the percentage of households in Canada who recycled or did other things to save energy and save our planet increased by about 25%1.
![]() Examine the table to see how many Canadian households are helping our environment:
Examine the table to see how many Canadian households are helping our environment:
Earth-friendly activities inCanada, 1994 and 2006
| Households that recycled: | Households that compos- ted |
Households that used any compact fluorescent bulbs | Main type of drinking water consumed: | ||||
|---|---|---|---|---|---|---|---|
| Metal cans | Plas-tics | Paper | Tap water | Bottled water | |||
| Canada 1994 | 56% | 52% | 58% | 23% | 19% | No data | No data |
| Canada 2006 | 81% | 84% | 83% | 27% | 58% | 58% | 29% |
Source: Statistics Canada, Households and the Environment Survey, 1994 and 2006
Use the table to answer these questions:
1. Circle the type of material that was being recycled by the greatest percentage of Canadian households, in 2006:
Metal cans Plastics Paper
2. From 1994 to 2006, what was the increase in the percentage of households that composted?
Percent: ![]()
Express as a fraction in lowest terms: ![]()
3. In 2006, what percentage of Canadians used at least one compact fluorescent light bulb in their home? ![]()
4. There were approximately 12,437,470 households in Canada in 2006. How many of them used at least one compact fluorescent light bulb? Show your work.
5. a) Do more Canadians drink tap water or bottled water?![]()
b) Do you think drinking tap water or bottled water is a better choice for the environment? Explain your reasoning.
![]()
![]()
Compare your class to Canada
6. Use your class Census at School database to find the percentage for your class in each of these categories:
| Households that recycled: | Households that composted | Households that used any compact fluorescent bulbs | Main type of drinking water consumed: | ||||
|---|---|---|---|---|---|---|---|
| Metal cans | Plastics | Paper | Tap water | Bottled water | |||
| Your class (%) | |||||||
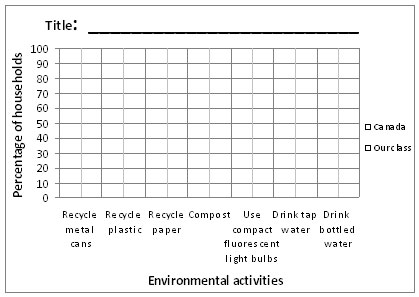
7. On the graph paper provided, make a double bar graph to compare the 2006 Canadian data with your class data for each of the categories in the table. Remember to include a title, as well as an appropriate scale and labels for the axes.
How Does Your Class Compare to Canada?
Use your graph to answer the following questions. (Use percentages to support your answers.)
8. In which categories is your class:
a) very similar to the rest of Canada?
![]()
![]()
b) more environmentally responsible than the rest of Canada?
![]()
![]()
c) less environmentally responsible than the rest of Canada?
![]()
![]()
9. In what type of environmental activity do you think Canada needs to improve most? How would this change the environment?
![]()
![]()
10. Name two things you and your household could do to improve your environmental practices.
a) ![]()
![]()
b) ![]()
![]()
1. Source: Statistics Canada, Households and the Environment Survey, 1994 and 2006